The Daily and Monthly values represent the compound percentage that needs to be applied to an investment over a specific timeframe (daily and monthly) in order to reach the same account gain.
When traders open a trading account they deposit an initial deposit (initial investment).
By trading and earning profits, they grow their initial investment.
What if the trader chose to put his initial investment in a compound interest savings account instead of trading? A compound interest savings account is when you put an initial investment and you earn a certain percentage for a certain period, each time you earn interest, your balance grows and next time you earn interest, it will be applied to the current balance (including the received interest) so with each interest, the next interest amount grows.
This is where the Daily and Monthly stats come in, they give the trader a sense of the amount of daily/monthly compound percentage they had to make in order to reach the account’s current gain.
Let’s take a look at an example account to understand it better:

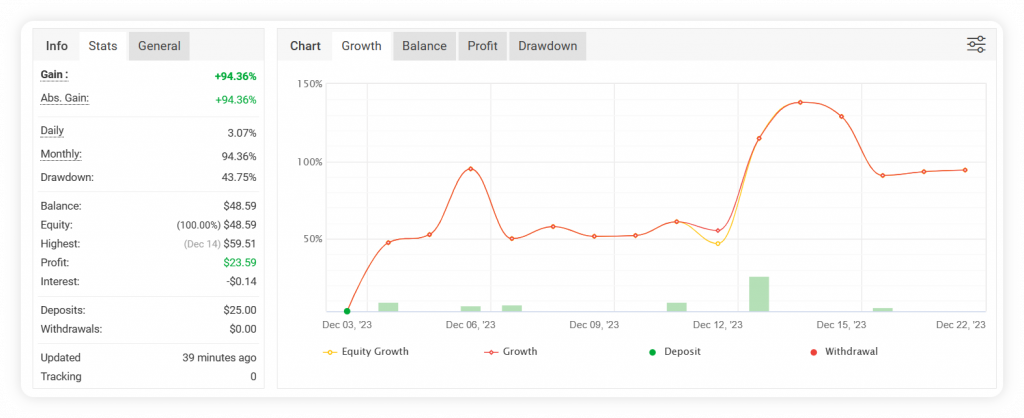
The account has a single deposit of $25. This specific account started on December 3rd 2023, at the time of writing this, the date is December 25th, so the account exists for 22 days or we can say that there are 22 daily periods from the account’s start until now. As you can see from the ‘Stats’ section, the Daily value is 3.07% and the account’s gain is 94.36%.
So if we phrase the information in terms of compound interest:
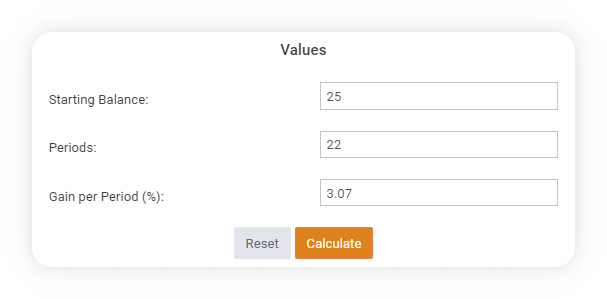
If the trader would’ve put his initial investment of $25 into a compound interest account for the same amount of days that this account exists, he would’ve needed a daily interest of 3.07% in order to grow that $25 into a 94.36% gain.
Myfxbook offers a compounding calculator where you can simulate this:


